Where Is Teaching Most Attractive and Equitable?
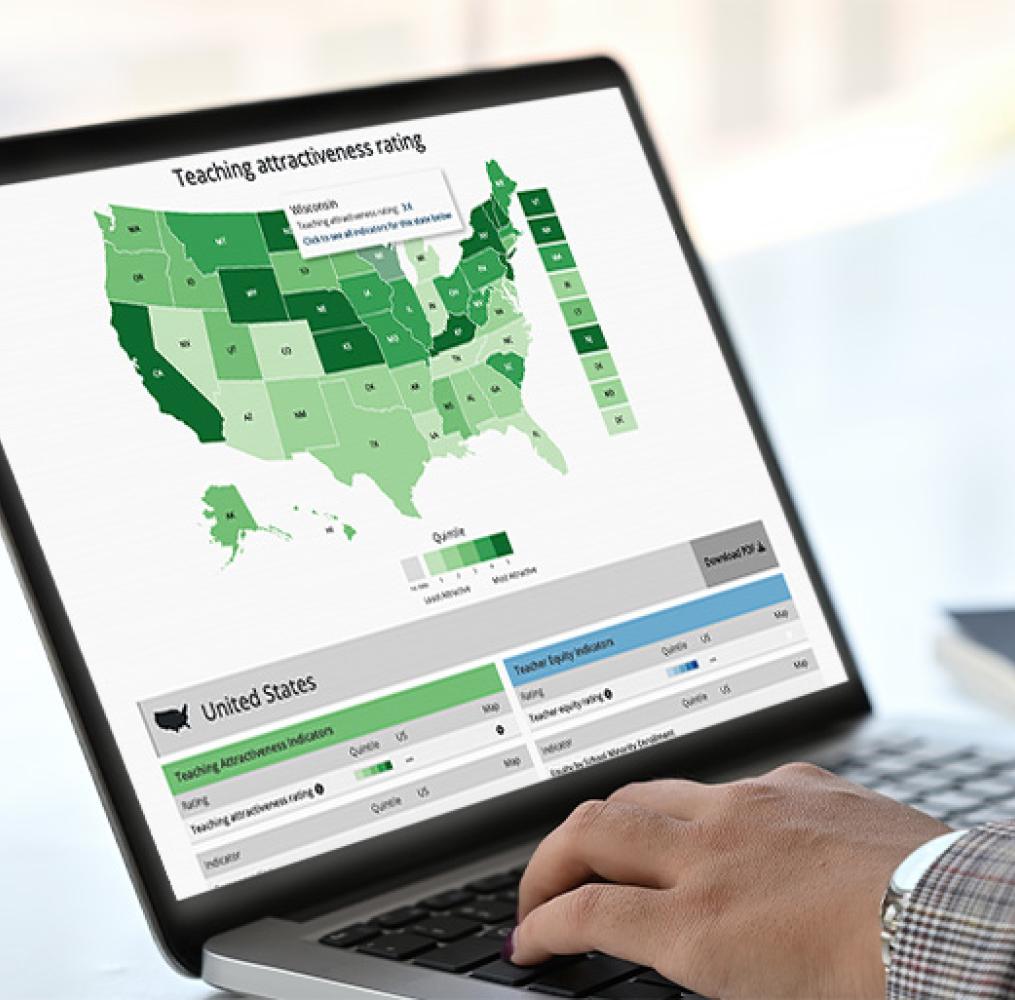
This brief from the Learning Policy Institute introduces the State of the Teacher Workforce Interactive Map, which includes more than 40 indicators and 2 summary ratings that describe teaching conditions and equitable access to well-qualified teachers in all 50 states and the District of Columbia. Updated in 2024, the map draws from recent national data sources, including the 2021–22 Teacher Follow-Up Survey and the 2020–21 Civil Rights Data Collection, to incorporate the latest information on teacher retention, certification, completion in teacher preparation programs, and student enrollment. The data enables policymakers to monitor conditions in their states and make comparisons with other states and the national average. There are significant variations in teaching conditions across states, with Midwestern and Northeastern states generally offering more competitive salaries and more supportive working environments. By focusing on both teaching attractiveness and teacher equity, the map highlights states that have been relatively effective at creating supportive teaching conditions to attract a well-qualified teacher workforce and ensure that students have equitable access to these teachers.